Previously…
Overview
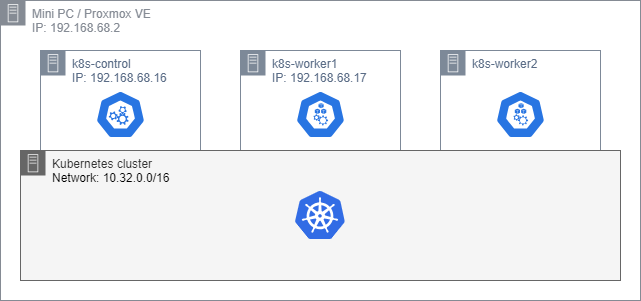
If you read my previous / first post, you know that by now I have Mini-PC with Proxmox Virtualization and a Kubernetes cluster of 3 nodes. All nice fresh and empty, a diagram of core elements is above.
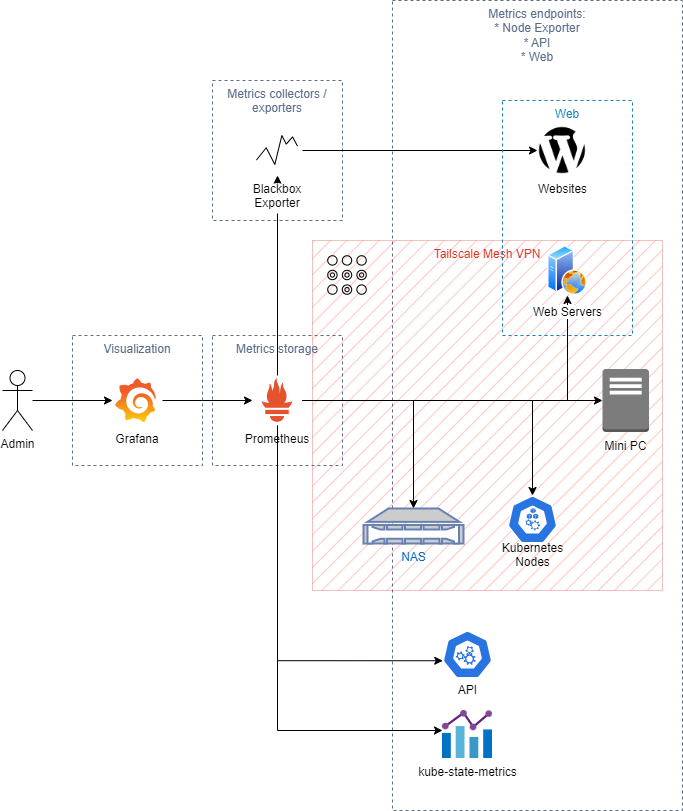
Now, let’s begin. The target for monitoring, at this point, is to have Prometheus for data collection and Grafana for visualization, and probably alerting. Haven’t decided yet if Grafana or Prometheus will do the alerts. Anyways, these two are key elements. In addition to those, as we will see later, we will need to have some other pieces too, and I have put together another diagram to show them:

Components and Services
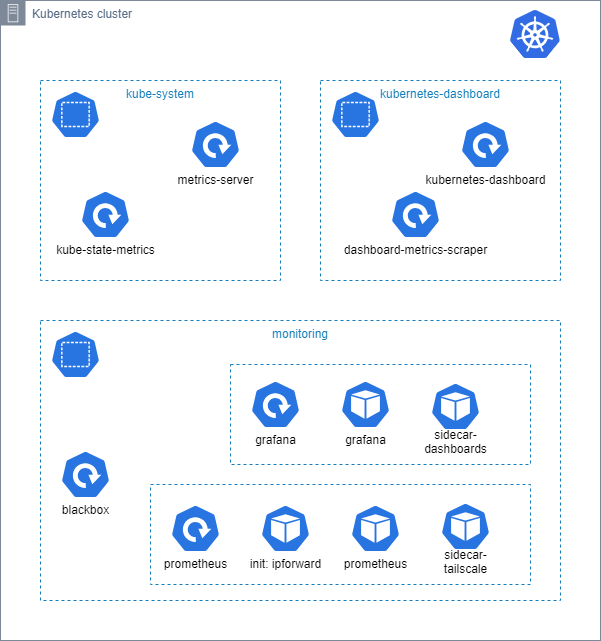
Below we can see the component overview – what I want to, and by the end of this post, will achieve:

Everything in this architecture is achieved using Kubernetes deployments. The whole code is stored in https://github.com/accesspc/home-lab-k8s. Configuration and deployment instructions are in README files in the forementioned repository. Let’s go through all of them in detail:
Admin
No surprises here, that’s me, or you, watching nice visualizations and listening to the silence of alerts.
Grafana
Grafana sits in a K8s deployment. Before K8s, I’ve used to store Grafana dashboards as JSON templates and deploy them with Terraform. That worked very well in Terraform world, but now, while creating this architecture, I discovered that Grafana has a Dashboard Provisioner / Provider, which takes dashboards stored as JSON files and applies them periodically to Grafana.
Now with K8s, Grafana sits in a Deployment / Container. And to update dashboards there were 2 methods that I considered:
- Using Grafana’s API, like with Terraform – didn’t quite liked it as it meant I would need to have a piece of Terraform to just manage Dashboards, whilst everything else is YAML for K8s
- Find a way to upload those JSONs directly onto Grafana container
This is were I found out, courtesy of Grafana Helm charts, that it is possible to have Dashboard JSONs stored as ConfigMaps and alongside Grafana attach a sidecar container, based on kiwigrid/k8s-sidecar. This sidecar’s sole purpose is to periodically watch K8s ConfigMaps where Grafana dashboards are stored, and if there are any changes, automatically apply them to Grafana. The flow of the dashboards would be something like this:
- Save dashboard JSON to a file inside a configuration folder
dashboards - Run Kustomize to validate the content
- Run
kubectl apply -k dashboardsto convert JSON files into ConfigMaps- Note: each JSON files has to go to a separate ConfigMap, because in-a-nutshell – ConfigMaps have length limits for annotations (that’s what I’ve found out when it failed for me to apply multiple files into one ConfigMap)
sidecar-dashboardscontainer watches ConfigMaps – if there is an update to any of them, it pulls it down and save to a file on a shared volume- Grafana Dashboard Provisioner watches this shared volume – if there is an update, picks it up and applies to Grafana.It can create, update and delete dashboards
Note! This method above can create, update and delete dashboards. So basically the state of ConfigMaps collection represents the state of Grafana’s dashboards.
Prometheus
Prometheus would be fine on its own container, but here I need some odd connections, so this is what we have. For Prometheus to be able to collect data from Node exporters running on remote endpoints privately, I’ve setup a Tailscale mesh VPN. It uses Wireguard underneath and is relatively easy to setup and connect new nodes to the network (more here).
Troubles: Tailscale can act as a router for site-to-site VPN, and that works fine for more traditional networks like your home LAN and AWS VPC. So I tried to install Tailscale on every K8s node expecting containers like Prometheus to be able to reach remote endpoints via VPN. Initially that worked, but a few minutes after setting it up Kubernetes core services started acting up and recycling. What I managed to figure out was that DNS got screwed up in K8s. Spent maybe half a day trying various options until I figured that I could run Tailscale node as a Sidecar to Prometheus.
That also solved a little security issue were, if site-to-site thing would’ve worked, all containers would be able to reach all remote endpoints, unless explicitly restricted either within Tailscale or/and on K8s. But that seemed like more work…
So I ended up expanding Prometheus Deployment from one container to 3:
- Init container
ipforward, that does what it says – runs first and enables IP forwarding via sysctl - Sidecar Tailscale, that connects and authenticates to Tailnet (Tailscale network) and routes the traffic to the endpoints
- And Prometheus, of course
This way only Prometheus is able to use Tailnet. Yay!
Blackbox exporter
A tiny exporter developed by Prometheus people, that is capable of making connections and collecting metrics using HTTP, TCP, SMTP, IRC, ICMP and DNS with various options.
Node exporter
Another tool that sits on nodes, endpoints, servers, containers and collects system metrics, like CPU, RAM, Disk, Network, etc.
Websites and Web Servers
This is kind of 2-in-1. Web servers are running Node exporters, to which Prometheus connects to via Tailnet and collects metrics.
Websites, are the services that Blackbox exporter connects to and collects metrics from the connections themselves. Blackbox doesn’t need any /metrics endpoints like Node exporter does.
Mini PC
That would be the nice little box that hosts all this beauty. It also runs Node exporter for Prometheus.
NAS
An external Asustor device, capable of running Docker containers. Node exporter is running as a container here. Alongside with Tailscale container. This way Prometheus is able to read Node metrics via Tailnet.
Kubernetes Nodes, API and kube-state-metrics
Next
All of them are K8s APIs. Prometheus has scrape configs for each of them and connects internally within Kubernetes.
The whole process of building this, discovering new services, new ways of working, was a very interesting journey. There still are lots of places for improvements, quite a few ideas of what I’d like to add or change, but I will leave it for the next time.
Oh, P.S. Grafana and Prometheus, to be able to retain information during updates and deployments, have PersistentVolumes which utilise NFS share hosted on the Mini PC / Proxmox box. Now this isn’t very elegant and definitely needs some work, as for each service there has to be a separate NFS share and that is not managed by K8s. Not yet at least. Something for the future posts!
